SeeTCR: an online platform for TCR sequencing data analysis
SeeTCR processes T-cell repertoire data and produces a variety of quantitative indices, graphs and comparisons.
Upload your samples (or our demo data) to start playing.
© 2016 Friedman Lab, Weizmann Institute of Science
Frequency of CDR3 Property
Graph Description
Labels:
Text sizes:
Options:
Plot parameters
Detailed CDR3 AA distribution
Graph Description
Labels:
Text sizes:
Options:
Plot parameters
Diversity
Graph Description
Parameters
Graph Description
Parameters
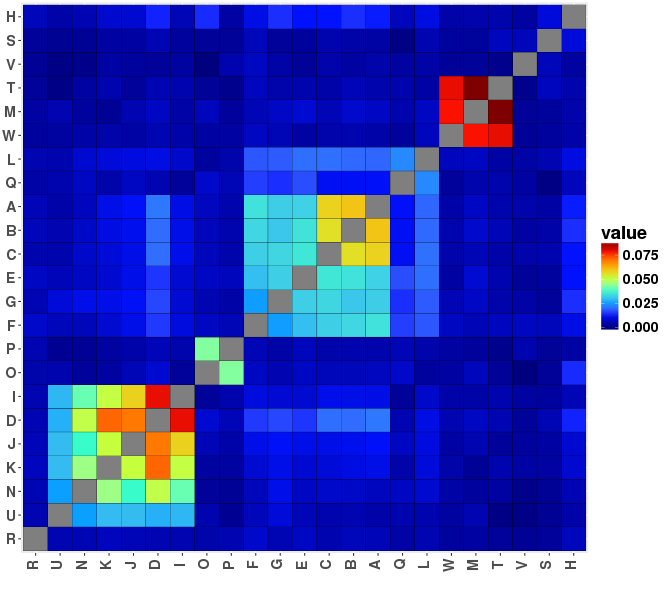
Similarity Heatmaps
Graph Description
The similarity heatmap is useful to get a global view of pairwise similarity across all samples in the dataset. The plot is symmetric, and rows / columns are either presented in original order or clustered. Each intersection of row and column indicates the value of the chosen index for a particular pair of samples. The higher the value, the more similar are the samples. The similarity indices available are:
Jaccard: measures degree of overlap, suitable for CDR3 sequences (calculated with binary=T).
Morrisita-Horn: Similar to Jaccard but accounts for CDR3 abundance and sample size. See Morisita's overlap index
Pearson: Standard Pearson correlation coefficient, takes count / frequency into account.
Spearman: Rank correlation, not affected by count.
Plot types
CDR3 Search - * page is under construction *
in TCRdb
search parameters
search results
Add Data to Project
Choose Samples from the table below
Example: 5:10, 12, 17:21
Selection Preview
All data
Current Session
Import sequence Annotation
Getting Started
What is SeeTCR?
SeeTCR is an online app for the analysis of T-cell sequencing data. It takes as input TCR repertoires and returns a collection of quantitative indices, graphs and comparisons. SeeTCR is web-based and there are no prerequisite software for using it.
How to use SeeTCR:
- Data formats and Preparation:
SeeTCR accepts data that contains CDR3 sequences, their frequency, and any other additional information. Data can be in Adaptive Biotechnologies’ Immunoseq format, or in csv files that contain: nucleotide sequences (the "CDR3_NT" column), amino acid sequences (the "CDR3_AA" column) and their frequency/copy number (the "count" column). The columns should be named as written in parenthesis. Besides the sequence and the frequency, the files may include any other columns, such as V/D/J genes, sequence length, etc. Click here to download an example of the required format. - Add data to session:
To start a session, click Data and then Add/edit samples. Choose the files you wish to upload (you can select multiple files at once). Alternatively, if you have previously saved sessions, you can load them by clicking "load session". Once the files are loaded, they will appear in the "edit metadata" section. Tip: You can always add files to an existing session, remove specific samples or clear everything and start from the beginning. - Edit the metadata:
Adding labels is useful for splitting the data into groups or categories and comparing these groups side by side. In many sections you will see an option to split the data by the different categories (see for example the "shared CDR3s" or "Frequency of CDR3 Property" sections). To add a new label, enter a title and click "add category". An empty column will be added to the metadata table, which you can fill manually or by pasting data from the clipboard. The labels can be of any type, like age, health, phenotype etc. - Import sequence annotation (optional):
If you have additional sequence information, it is possible to add it to the session. This information should be in the form of a csv/txt file that contains the sequences and the annotation. Once the annotations are loaded, you will be able to see them in Data -> View raw data, and in Visualiztion -> "Frequency of property". - Analyze the data:
- Statistics
- Sequence sharing
- CDR3 search
- McPAS-TCR
- Visualize the data:
- Frequency of Property
- Sequence Distribution
- Tile Plots
- Diversity
About
SeeTCR is developed and maintained by
the Friedman Lab at the Weizmann Institute
of Science. It is written in R using the Shiny package.
For questions or comments please
contact us at: tal.sagiv@weizmann.co.il